
Forage Into the Future #11: VC + Startup Updates [Biopharma, KPIs, and AI + what to build with Claude]
Forage Into the Future #11: VC + Startup Updates [Biopharma, KPIs, and AI + what to build with Claude]
On the resurgence in biopharma funding, (still) soaring AI valuations, and VCs focusing on operational efficiency KPIs. Plus, what to build with Claude's Artefact feature.

Welcome to another edition of Forage Into The Future, your launchpad for navigating VC and Startups. I am Abhinav, and I will be your guide, curating the most important insights, groundbreaking news, and resources to keep you “light-years” ahead of the curve.
Whether you're a seasoned investor, just making you foray into VC/PE, or a starry-eyed entrepreneur just starting your journey, this newsletter is your mission control for all things VC and startups.
Let’s go!
A. Interesting Reports
The JP Morgan US Licensing and Venture Report just came out. I strongly recommend it if you work in Biopharma or allied sectors. A ton of interesting information, but let me focus on three key facets: (i) on deals, per se; (ii) on deal structures; and (iii) on exit outcomes.
(i) On Deals, per se:
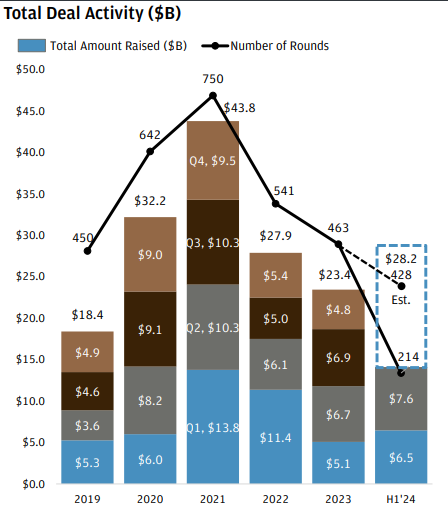
Venture Investments Rebound: Biopharma venture investments are showing signs of recovery after a two-year downtrend. Q2 2024 saw $7.6 billion invested across 107 rounds, surpassing both Q1 2024 and the respective quarters in 2023.
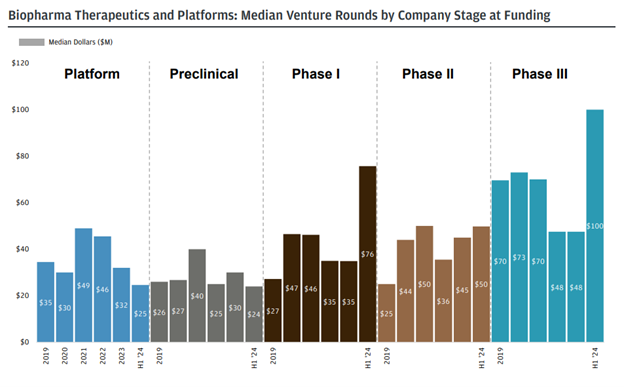
Increased Deal Values for Clinical Stage Companies: Median venture round sizes increased for companies with lead programs in Phase I-III. Phase III companies saw a median round of $100 million, while Phase I companies saw a median of $76 million, more than double the 2023 figure.
Mega Rounds Still Prevalent: Despite a downward trend in the overall number of venture deals, large rounds ($100M+) are still prevalent, with 50 companies raising such rounds in H1 2024.
Modest Seed & Series A Growth: Seed and Series A funding reached $5.1 billion across 105 rounds in H1 2024, indicating continued new company creation and investment in early-stage innovation.
On Deal Structuring:
Licensing Deals Favor Milestones: Biopharma licensing partnerships saw $76.3 billion in total deal value in H1 2024. However, only 6% of this was in upfront payments, significantly down from previous years - indicating a shift towards milestone-based payments to de-risk partnerships for buyers.
Big Pharma Focus on Late-Stage Assets: Large-cap biopharma companies are increasingly in-licensing later-stage clinical compounds (Phase III), pushing up median upfront payments for these programs while lowering them for earlier stage assets.
Biologics and Small Molecules Dominate: Biologics and small molecules continue to lead both early-stage investment and licensing deal values. Antibody-based therapies, including ADCs, are driving significant deal values within the biologics category.
On Exit Outcomes:
M&A Activity Picks Up: Biopharma M&A activity picked up in Q2 2024 with 26 transactions totaling $17.9 billion. Private biopharma acquisitions increased as a share of overall M&A.
IPO Market Shows Positive Signals: The first half of 2024 saw 10 biopharma IPOs completed on US exchanges, raising a total of $1.9 billion. This suggests a potential return to a more active IPO market after a relatively quiet period.

Carta also released their Compensation Report for H1, 2024. Let me do a quick recap of the important bits encapsulated:
Shorter Employee Tenure: Employees are staying in their roles for shorter periods, particularly since the pandemic, with almost half of those hired in 2021 leaving within two years. However, this trend may be reversing.
Smaller Fundraising Teams: Startups are raising capital with leaner teams compared to previous years, indicating a focus on efficiency and cost control.
Salary Benchmarks Stable: Average salary benchmarks have seen modest increases (around 0.5%) in recent months, but remain below inflation levels.
Equity Packages Find New Normal: After a sharp decline in late 2022 and 2023, the average size of equity packages offered to new hires has stabilized.
Low Option Exercise Rates: Employees are exercising their stock options at lower rates, likely reflecting decreased confidence in venture-backed valuations.
Extended Exercise Windows: Companies are increasingly offering extended post-termination exercise periods for stock options, potentially as a response to higher layoff rates and a changing landscape.
Option Repricing Activity Slows: While option repricings have been more common since the 2022 venture slowdown, they have declined from their peak in Q1 2023.
Sectoral Differences in Headcount Growth: Energy, medical devices, and hardware sectors have seen net headcount growth in 2024, while other sectors have experienced declines or flat growth.
SaaS Startup Size Reduction: Average headcount for SaaS startups has decreased across various fundraising stages, particularly at Series C, reflecting the broader venture market slowdown.
Seed-Stage Headcount Varies by Industry: Seed-stage headcount trends differ significantly across industries, with healthtech seeing growth while consumer startups have shrunk.

Aumni recently analyzed 10k+ data points to discern what metrics investors actually want to see. When it comes to securing venture capital, four key metrics stand out as essential across all stages of a startup's growth. These "Core 4" metrics give VCs a clear picture of a company's health and potential
Revenue, net burn rate, FT headcount, and gross margin are consistently requested metrics across all stages.
The average venture firm requests 6-9 metrics per quarter from each portfolio company.
Cash metrics are crucial in early stages but become less important as companies mature.
Operational efficiency metrics gain prominence in later stages, particularly at Series D+.
This trend toward robust operational metrics is likely to continue, especially as Series D+ funding and exits become more challenging.
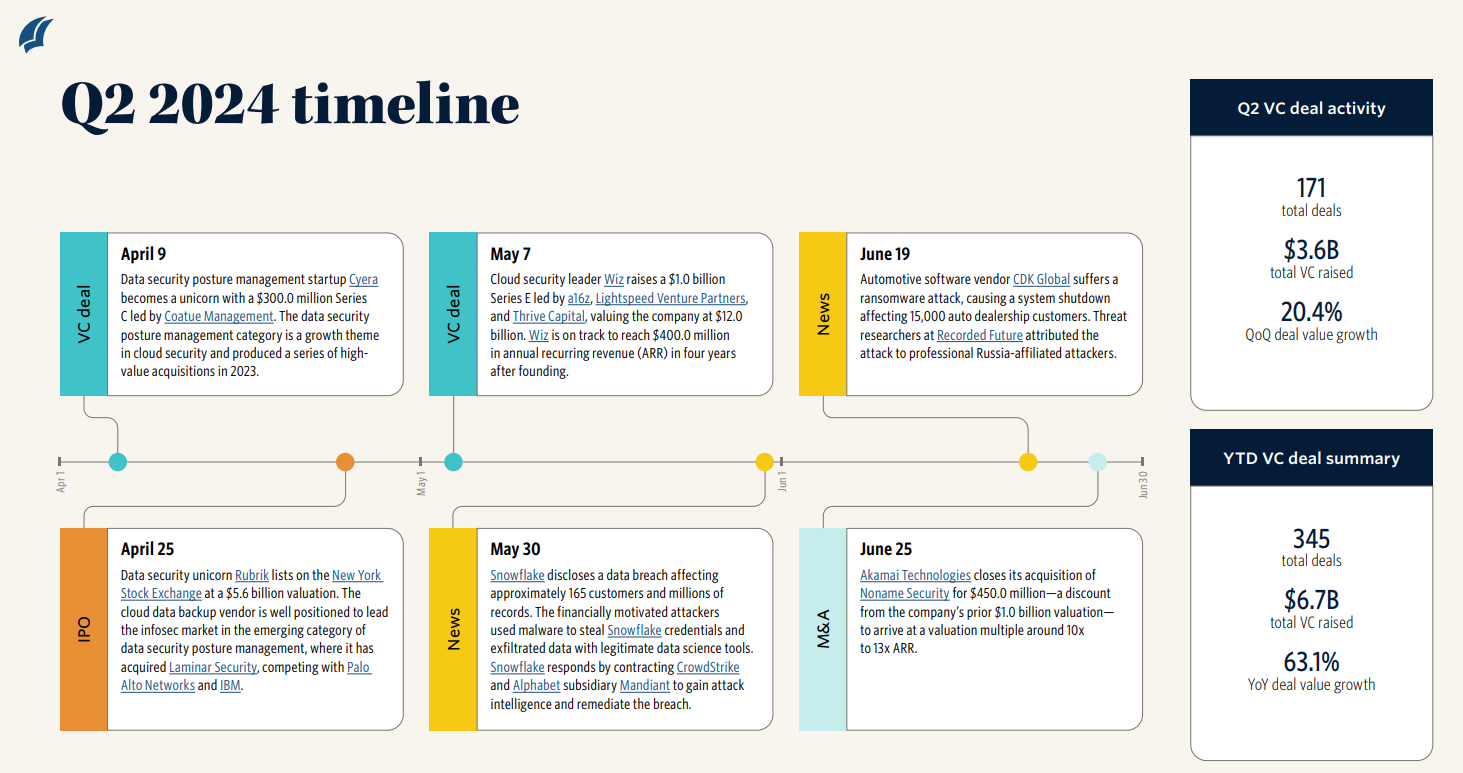
Pitchbook has just shared its report on the Information Security Market. Information security startups brought in $3.6 billion in VC funding in Q2 2024—a 20.4% increase over the previous quarter
B. Market Updates
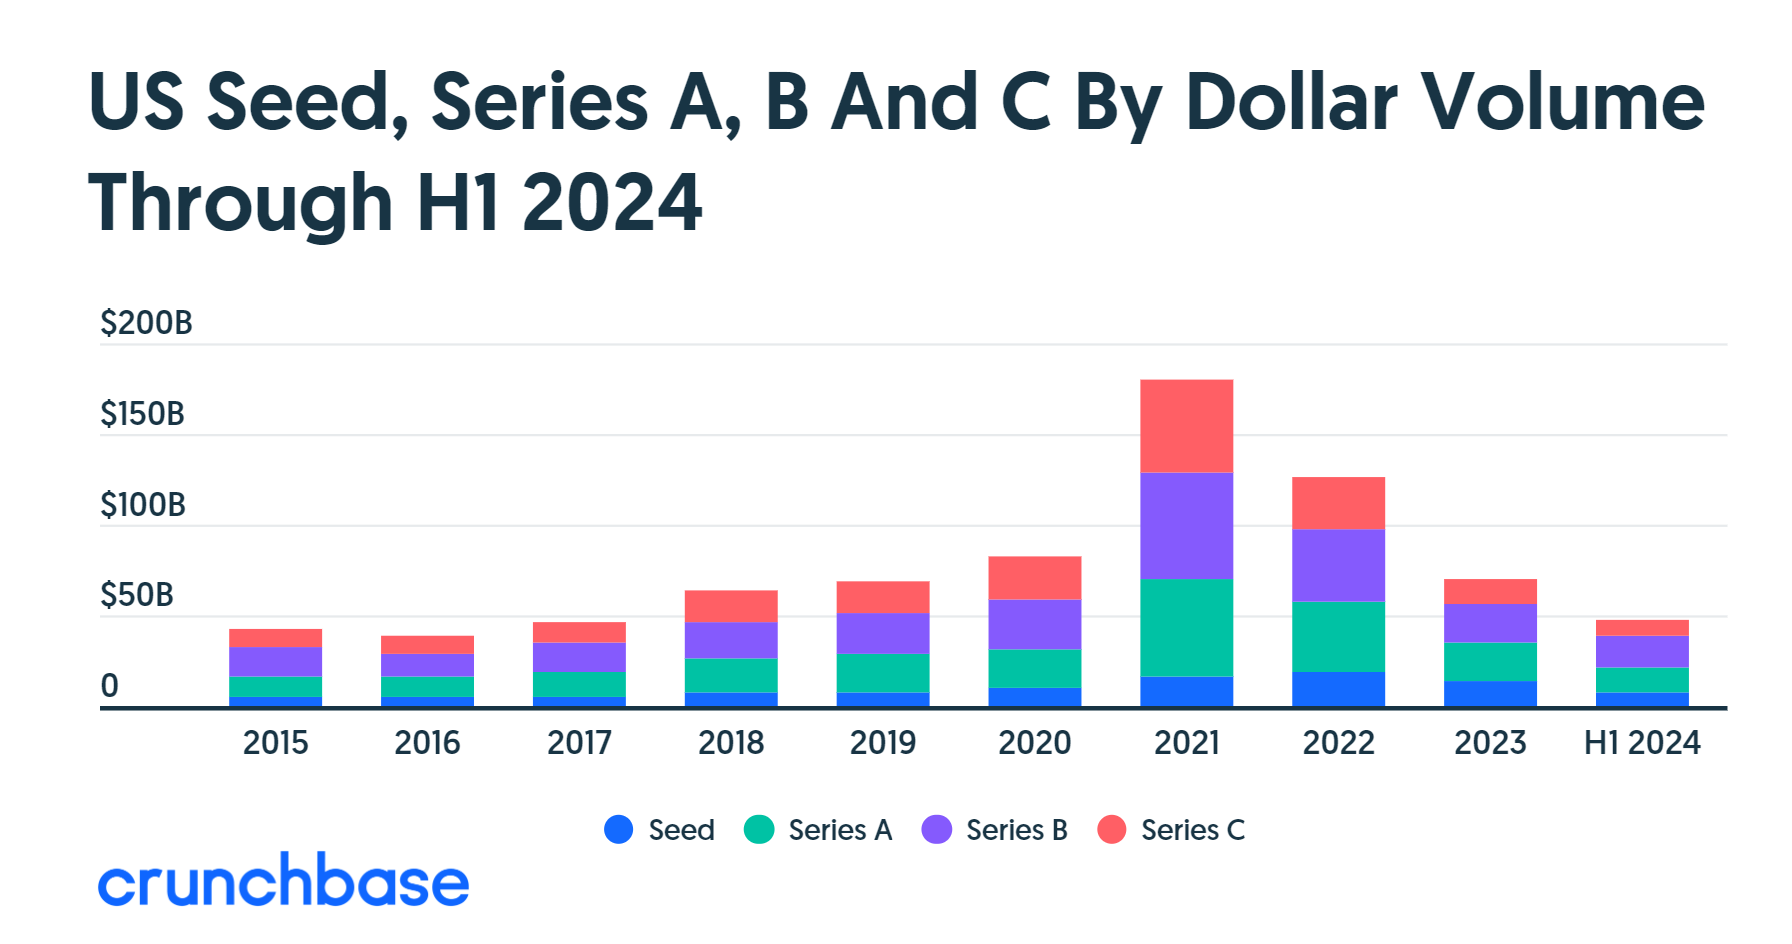
Crunchbase analyzed US Seed, Series A, B & C Rounds for H1 2024 and sizes are rising (among other more specific cross-sectional insight). FYI, here is the quick lowdown:
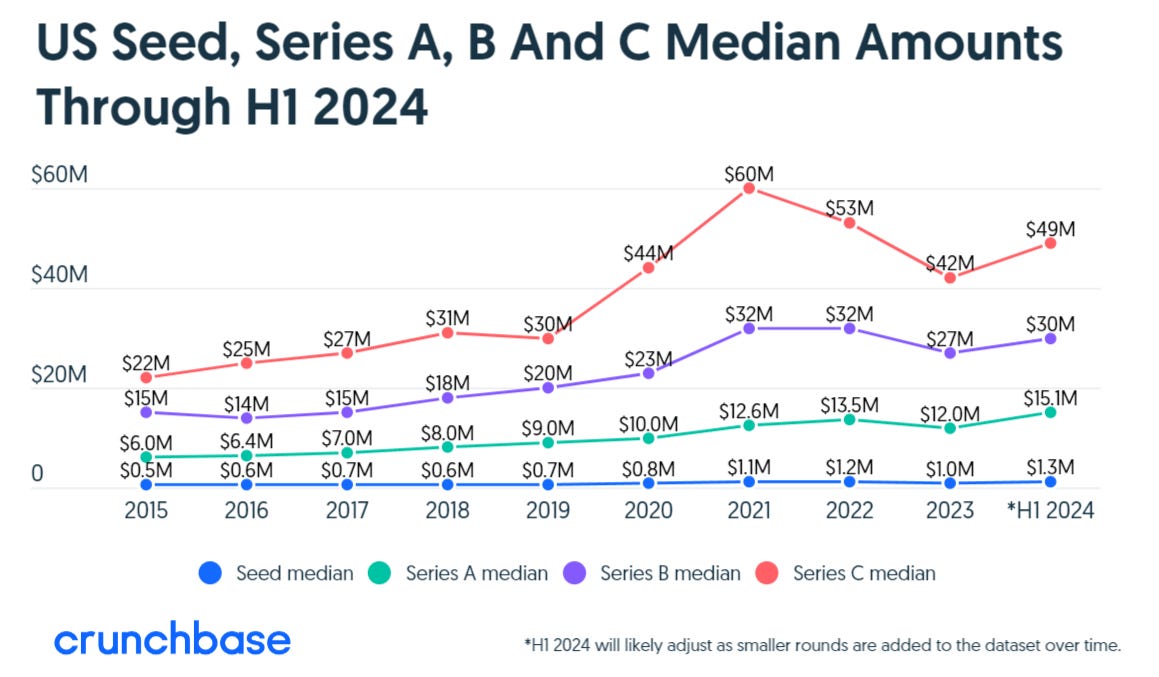
After a decline in early 2023, median round sizes for seed through Series C funding have increased in the first half of 2024.
This increase is most pronounced for seed and Series A rounds, surpassing 2021 and 2022 levels.
While Series B and C rounds are below their 2021 peaks, they are still up from 2023.
The growth in funding is largely driven by larger investments, particularly in AI companies.
AI companies are seeing valuations 1.6x higher and average round sizes 1.4x larger than non-AI companies.
What this means for you? Depending on what stage you are at:
Seed: The largest growth variance at each quartile, indicating seed can represent different funding stages. Median upper quartile has been $3 million or higher since 2021.
Series A: Median round has been $12 million or more since 2021, with upper quartile at $20 million or more. The time between Seed and Series A rounds has extended, leading to more mature companies seeking Series A funding.
Series B: Median round has been $27 million or more since 2021, with upper quartile at $50 million or above. There's been an uptick in the number of companies raising and deals done in the first half of 2024.
Series C: Median round in H1 2024 was down from the peak but still above the 2020 median.
Sozo Ventures to Raise $500M for its fourth fund. The firm typically invests in IT startups and helps them expand globally. Sozo is known for its early bets on Twitter, Palantir, Zoom, and others.
Robot Ventures Secures $75M for its fourth fund to back early-stage crypto startups. The fourth fund is three times larger than its previous funds. Notable startups in the firm’s portfolio include EigenLayer, Flashbots, and Together AI. VC investment in the crypto space has increased since the bear market of 2022.
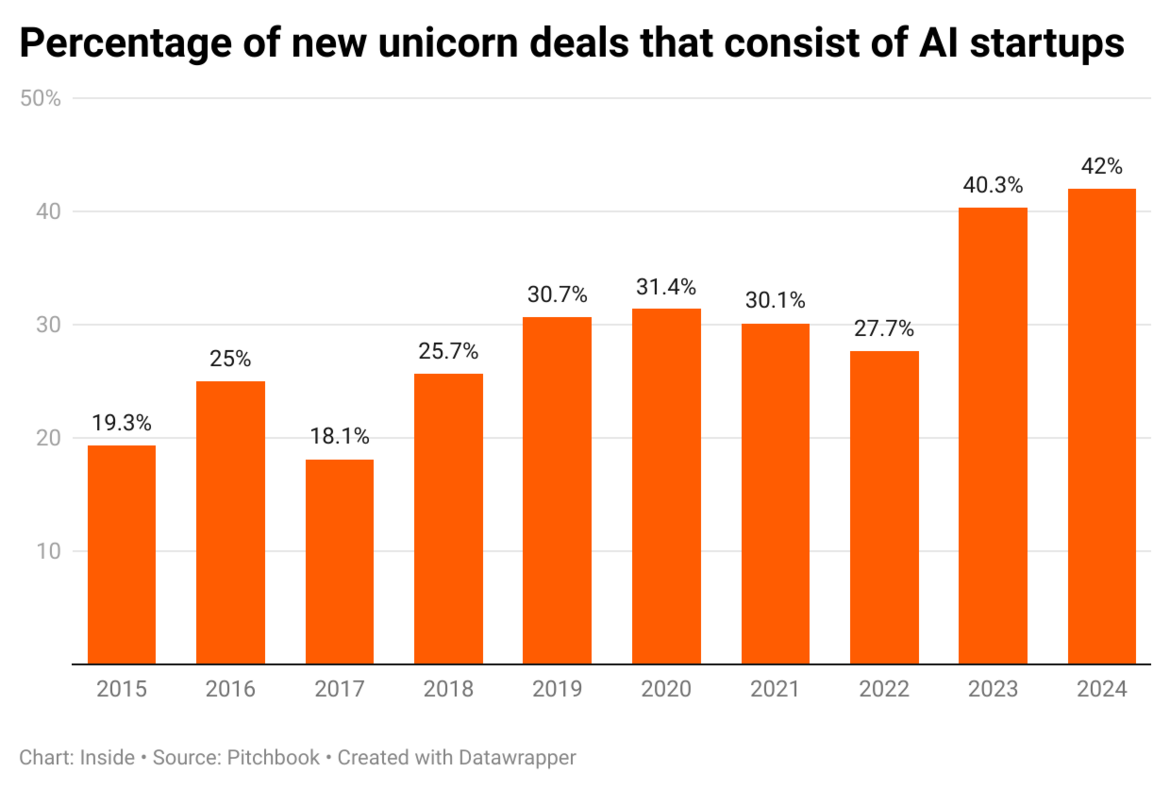
Codeium became the latest AI startup to enter the unicorn club, with a $150M Series C funding round that valued the firm at $1.25B. General Catalyst led the Series C round, with additional backing from Greenoaks and Series B lead investor Kleiner Perkins. (The startup’s valuation has more than doubled over its $500M valuation from the Series B round in January.)
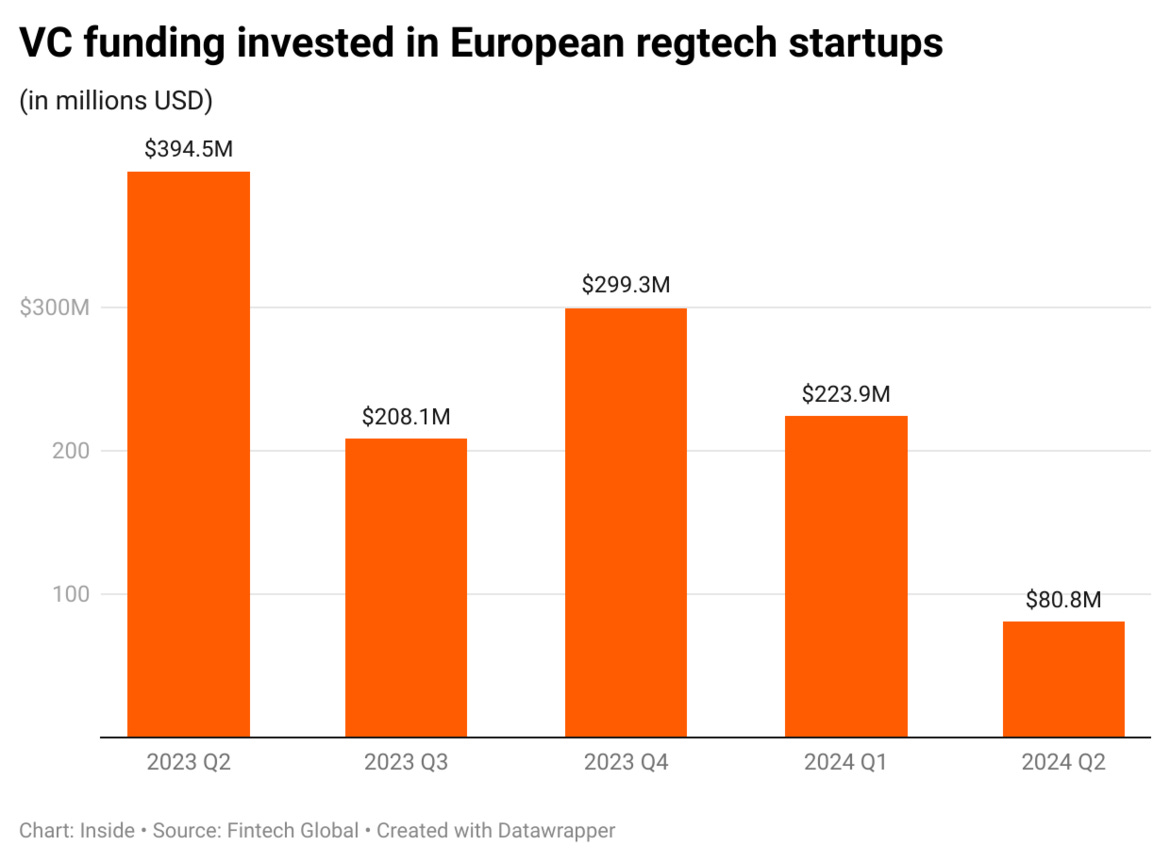
European RegTech investments sharply declined in Q2 2024, with deal activity plummeting 74% YoY.
Only 18 deals were completed in Q2 2024, compared to 69 in Q2 2023. Total funding dropped 80% YoY to $80.8M, a fraction of the $394.5M invested a year ago.
Deal activity and value declined 45% and 64%, respectively, compared to $223.9M invested across 33 deals in Q1 2024.
The average deal size fell 34% QoQ to $4.5M, reflecting growing investor caution in a challenging economic environment.
The average deal size was $6.8M in Q1 2024 and $5.7M in Q2 2023.
Marks their return to the secondaries market after registering as an RIA in 2023.
The secondaries market is experiencing significant growth, driven by various investment types. ($706M invested in direct secondaries deals in H1 2024, on track to surpass 2023's $1.1B total.)
Other firms like StepStone, G Squared, and Industry Ventures have also raised dedicated secondaries funds.
Arāya Ventures , founded and led by entrepreneur-turned-investor Rupa Popat, has successfully completed the first close of its Arāya Super Angel Fund, raising over €9.8 million .
C. Founders & Operators

Bootstrapped vs. VC-Backed SaaS: Insights from ChartMogul & Dealroom - On the age old question of ‘Bootstrapping vs VC-backing’, ChartMogul does an interesting bit of analysis for SaaS companies. Some snippets from their analysis:
Bootstrapped companies exhibit more linear and consistent growth, while VC-backed companies experience faster, but more volatile, growth.
VC-backed companies generally reach $1M ARR faster (under 3 years vs. over 3 years for bootstrapped), particularly at the median and top quartiles. However, top quartile bootstrapped companies reach $1M ARR only 4 months slower than VC-backed businesses.
Below $500K ARR, there's little performance difference between funding models, but VC-backed companies tend to pull ahead beyond that milestone.
The economic downturn hit VC-backed startups below $1M ARR the hardest, showcasing their vulnerability to capital availability. Bootstrappers, while not immune, maintained more consistent growth rates.
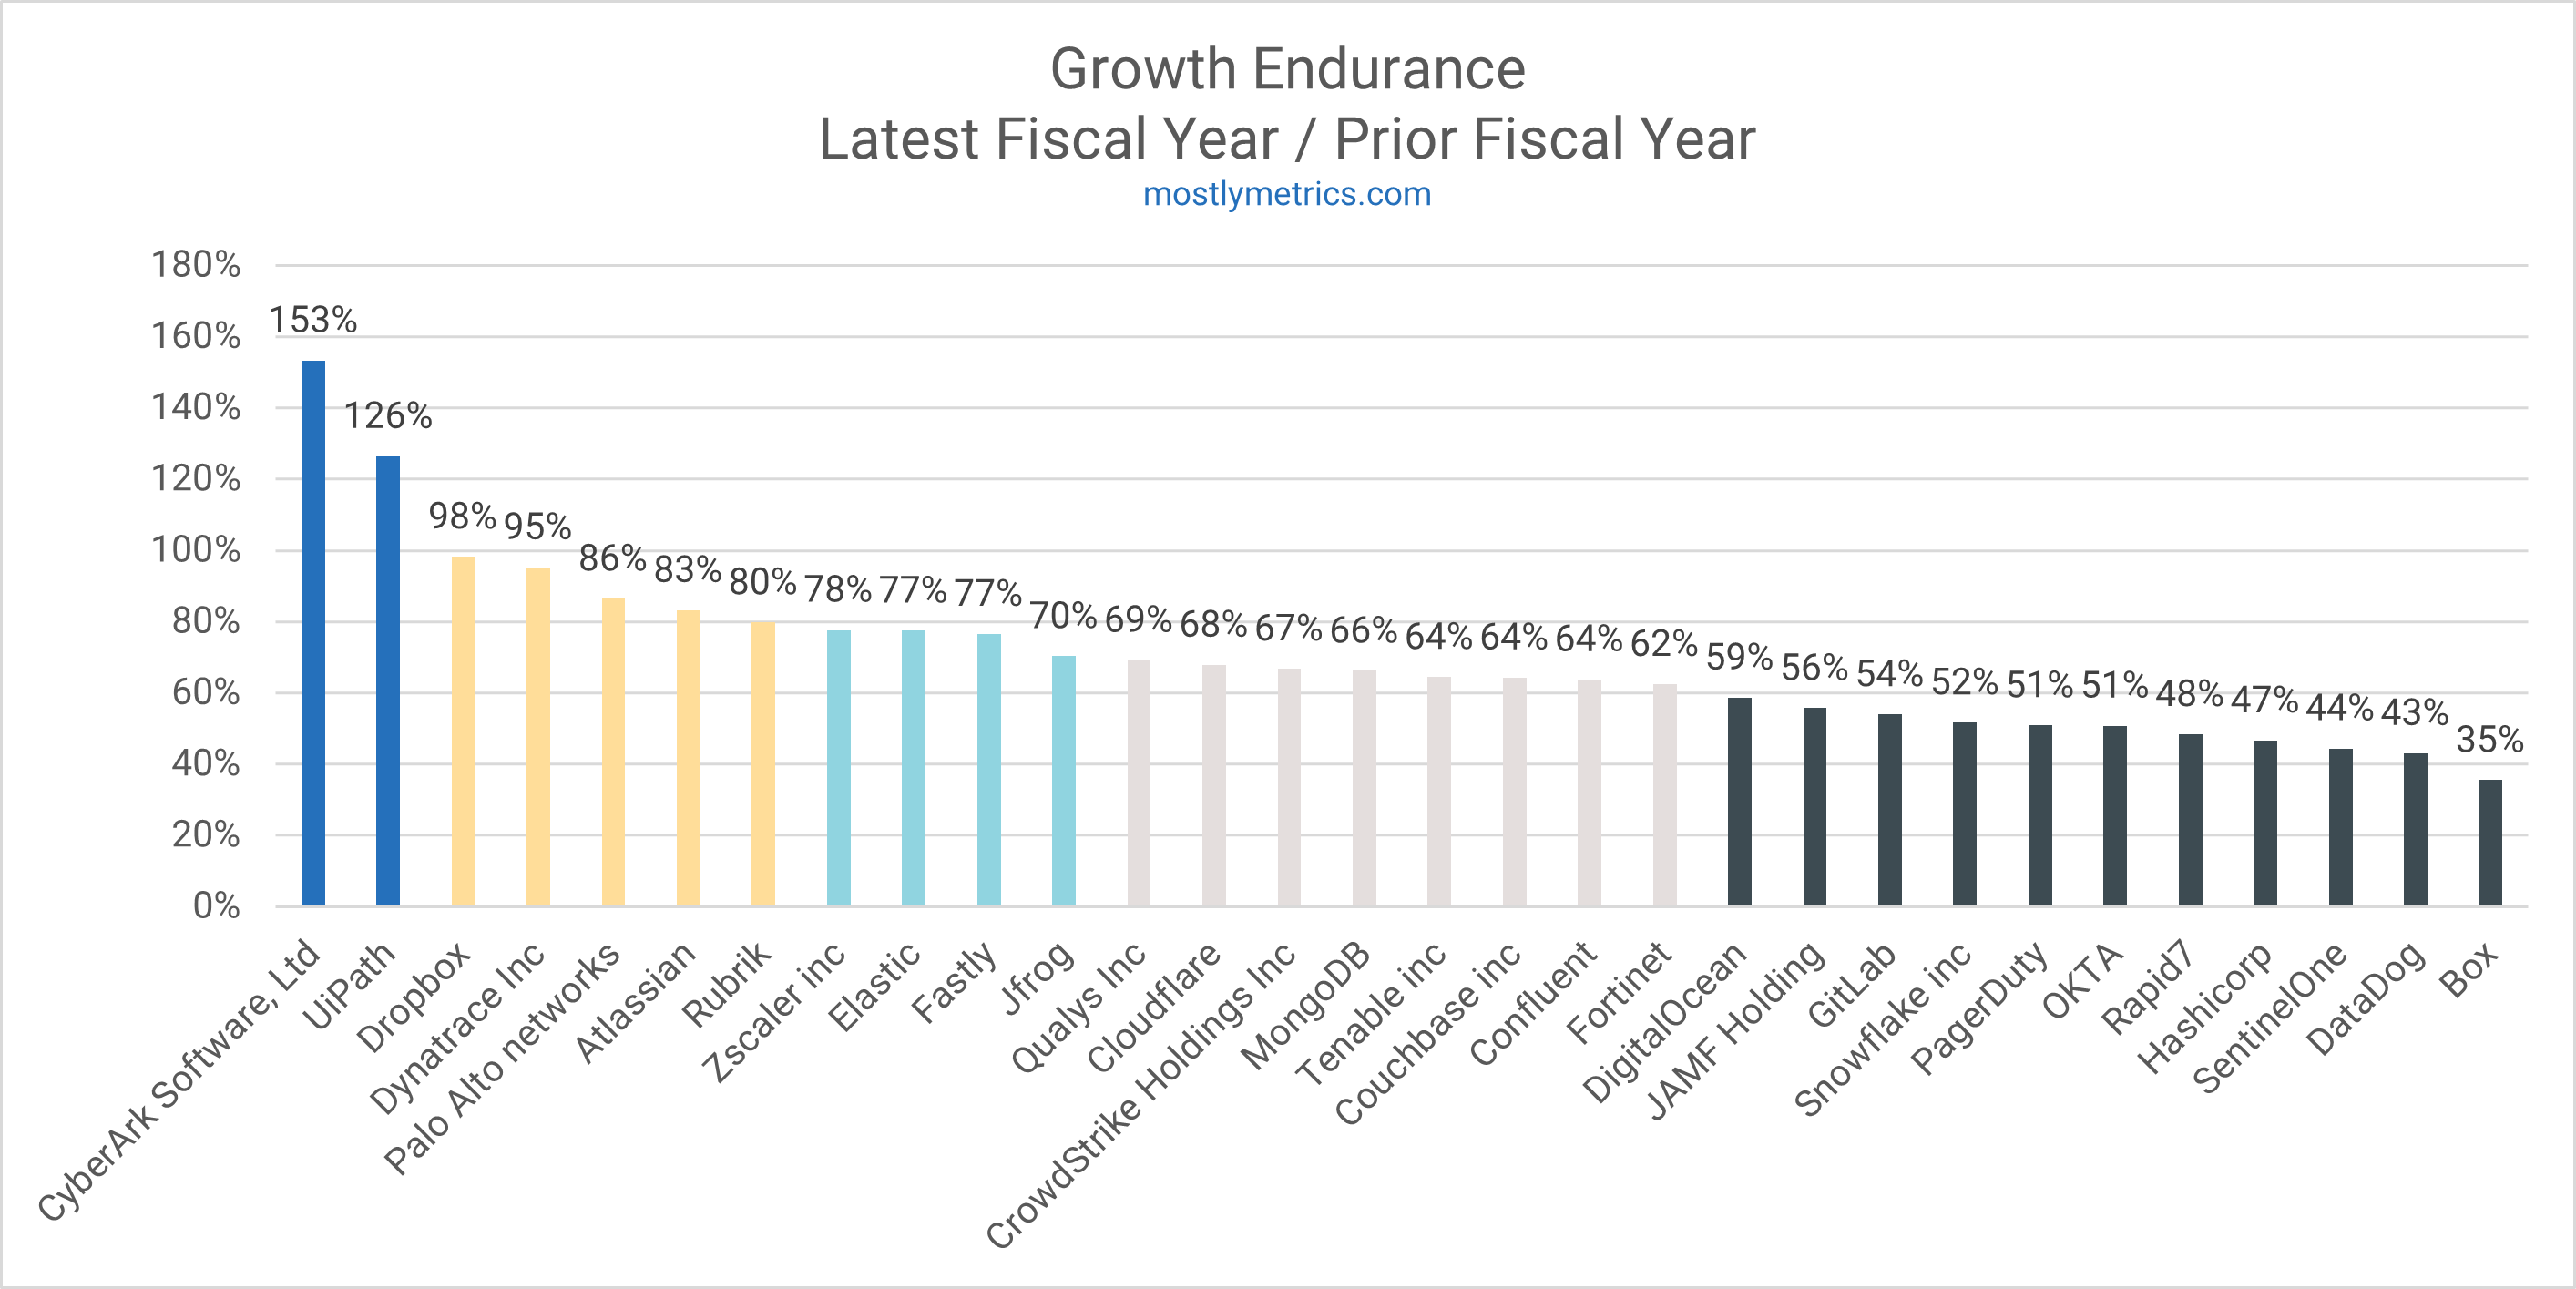
‘Revenue Growth Endurance’ is the secret to sustained SaaS growth. It's not just about acquiring new customers; it's about keeping them. This metric measures how well your company maintains its growth rate over time, even as your revenue base expands. Check out this insightful article by CJ Gustafson: ‘Understanding Revenue Growth Endurance’. (MostlyMetrics)
On Vertical Integrators [Patty McCormick]: Peter Thiel had once spoken about ‘complex, vertically-integrated monopolies’ and Patty McCormick does an excellent analysis of vertical integrators on his ‘Not Boring’ Substack.
Claude + Artefacts Guides / Ideas: As you may know, Claude is now running its ‘Artefacts’ feature across all platforms (including mobile). Want to build something cool with it? The tool currently supports code snippets, flowcharts, SVG graphics, websites, or interactive dashboards.
Here are some examples of how Artifacts can be used:
Developers can make architecture diagrams from codebases
Product managers can create interactive prototypes for rapid feature testing
Designers can build powerful visualizations for quick prototyping
Marketers can design campaign dashboards with performance metrics
Sales teams can visualize sales pipelines with forecasting insights
That’s all folks for this edition!